
Статья опубликована в рамках: Научного журнала «Студенческий» № 35(373)
Рубрика журнала: Информационные технологии
Скачать книгу(-и): Скачать книгу
THRESHOLD-OPTIMIZED LOGISTIC REGRESSION FOR TYPE 2 DIABETES SCREENING: INTERPRETABLE MODEL DEVELOPMENT AND WEB-BASED DEPLOYMENT

Abstract
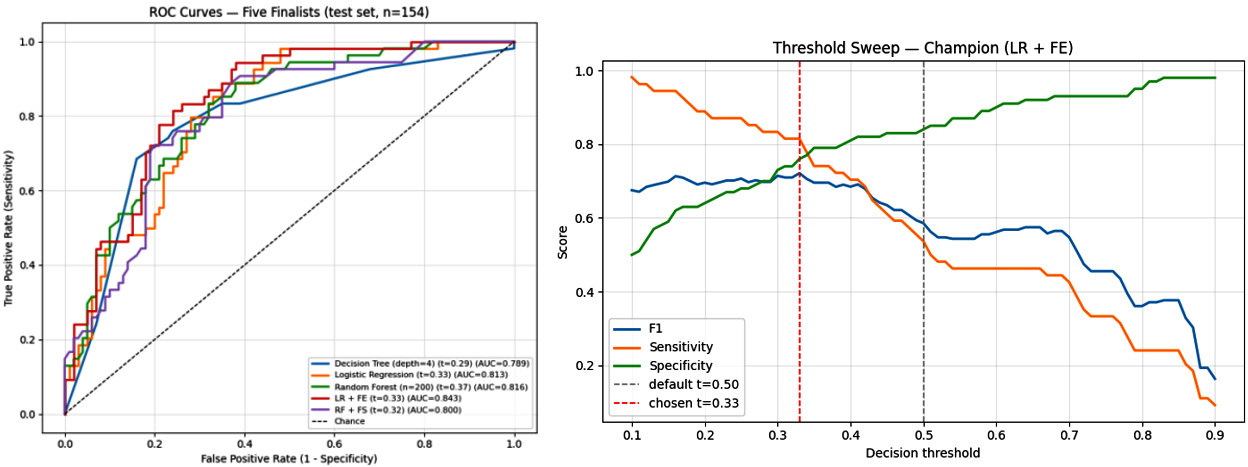
Default 0.50 thresholds cause machine-learning classifiers to miss many diabetes cases. Using 768 patients from the Pima Indians Diabetes Database (34.9 % prevalence; 80/20 split), we compared five candidates by test-set AUC at each model's optimized threshold. Feature-engineered logistic regression (23 features) won (AUC 0.843 vs 0.789–0.816); at t = 0.33 it reached 81.5 % sensitivity and 76.0 % specificity, missing 10 of 54 diabetic patients versus 26 at 0.50 — a 61.5 % relative reduction. The model was deployed as a web application.
Аннотация
Порог по умолчанию 0,50 приводит к тому, что классификаторы машинного обучения пропускают многие случаи диабета. На данных 768 пациентов из базы Pima Indians Diabetes Database (распространённость 34,9 %; разбиение 80/20) мы сравнили пять кандидатов по AUC на тестовой выборке при индивидуально оптимизированных порогах. Победила логистическая регрессия с конструированием признаков (23 признака): AUC 0,843 против 0,789–0,816; при t = 0,33 достигнуты чувствительность 81,5 % и специфичность 76,0 % — пропущено 10 из 54 пациентов с диабетом против 26 при пороге 0,50 (относительное снижение 61,5 %). Модель интерпретируема и развёрнута как веб-приложение.
Keywords: diabetes mellitus, logistic regression, feature engineering, screening, decision threshold, web deployment.
Ключевые слова: сахарный диабет, логистическая регрессия, конструирование признаков, скрининг, порог отсечения, веб-развёртывание.
1.Introduction
Type 2 diabetes affects hundreds of millions worldwide and often remains asymptomatic until complications appear [1], so tools that flag high-risk individuals from routine measurements can prompt earlier confirmatory testing [2]. Machine-learning (ML) studies, however, favor black-box models optimized for aggregate accuracy, which clinicians cannot inspect, and evaluate them at a default 0.50 threshold — an inappropriate trade-off for screening, where a missed diagnosis costs far more than an unnecessary confirmatory test [2]. We hypothesized that a transparent linear model enriched with domain-informed feature engineering could match or exceed more complex algorithms while remaining fully interpretable, and tested this end-to-end, from a public dataset to a deployed web tool.
2. Methods
Data. The publicly available Pima Indians Diabetes Database contains 768 adult female patients described by eight routine variables (Pregnancies, Glucose, BloodPressure, SkinThickness, Insulin, BMI, DiabetesPedigreeFunction, Age); 268 had diabetes (34.9 %). Physiologically impossible zeros (Glucose, BloodPressure, BMI, Insulin, SkinThickness) were replaced by variable medians, and the data were split 80/20 into training (n = 614) and held-out test (n = 154) sets with preserved outcome distribution.
Models and features. Fifteen derived features — squared terms (Glucose_sq, BMI_sq), log transforms (Glucose_log, Insulin_log), an age-group indicator (Age_group_41–50), and pairwise interactions (BMI×Age, Insulin×Age) — gave 23 inputs. Five finalists (decision tree, LR, random forest, LR+FE, RF+feature selection) were compared on test-set AUC, each at its own optimized threshold, with generalization judged by the train–test gap.
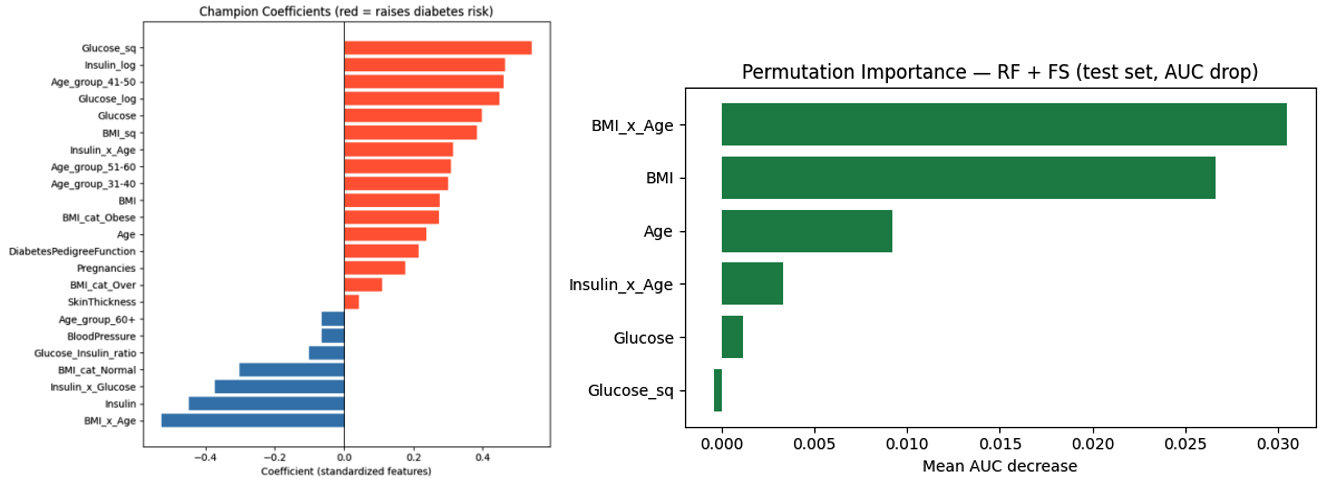
Threshold and evaluation. For the champion, thresholds were swept 0.05–0.95; t = 0.33 was selected to prioritize sensitivity while retaining acceptable specificity [2]. Accuracy, sensitivity, specificity, PPV, and the confusion matrix were computed on the test set; interpretation used standardized coefficients [3] and permutation importance. The model was deployed as an interactive web application.
3. Results and Discussion
Glucose correlated most strongly with outcome (means: age 33.2 y, BMI 32.0 kg/m², glucose 120.9 mg/dL). LR+FE was champion (AUC 0.843; Table 1). Random forests reached training AUC 1.00 yet generalized worse — textbook overfitting — whereas LR+FE showed a small train–test gap (train AUC ≈ 0.80). Threshold optimization alone cut missed cases from 26 to 13; adding feature engineering reduced them to 10 while raising sensitivity (75.9 % → 81.5 %), specificity (74.0 % → 76.0 %), and accuracy (74.7 % → 77.9 %) simultaneously (TN 76, FP 24, FN 10, TP 44). The gain thus decomposes: threshold tuning fixes the operating point, whereas feature engineering improves the model itself — a genuine gain, not a trade-off. The largest coefficients (Glucose_sq, β ≈ 0.47; Insulin_log; Age_group_41–50) and permutation importance (BMI×Age, BMI, Age, Insulin×Age) match established epidemiology. Forest overfitting is expected at n = 614, where regularized linear models are strong baselines; our AUC sits in the upper part of the published 0.77–0.86 range, unlike most work, reports a clinically motivated threshold and a deployed tool. Limitations: retrospective single-cohort data, no external validation, and selection/tuning on the same held-out set.
Table 1.
From baseline to champion (test set, n = 154)
| Model | t | AUC | Accuracy | Sensitivity | Specificity | PPV | FN |
|---|---|---|---|---|---|---|---|
| Decision Tree | 0.29 | 0.789 | — | — | — | — | — |
| LR | 0.33 | 0.813 | 74.7% | 75.9% | 74.0% | 61.2% | 13/54 |
| RF | 0.37 | 0.816 | — | — | — | — | — |
| LR+FE | 0.33 | 0.843 | 77.9% | 81.5% | 76.0% | 64.7% | 10/54 |
| RF+FS | 0.32 | 0.800 | — | — | — | — | — |
| Baseline LR | 0.50 | — | 71.4% | 51.9% | 82.0% | 60.9% | 26/54 |
4. Conclusions
Domain-informed feature engineering plus clinical threshold optimization made a transparent logistic regression the best-performing and best-generalizing of five finalists, cutting missed diabetic cases from 26 to 10 of 54 (61.5 % relative reduction) while improving accuracy, sensitivity, and specificity together, and was deployed end-to-end as a usable web screening tool.
References
- International Diabetes Federation. IDF Diabetes Atlas. 10th ed. Brussels: IDF;. – 2021.
- American Diabetes Association. Classification and diagnosis of diabetes: Standards of Medical Care in Diabetes. Diabetes Care. 2021;44(Suppl 1):S15–S33.
- Hosmer DW Jr, Lemeshow S, Sturdivant RX. Applied Logistic Regression. 3rd ed. Hoboken, NJ: Wiley;. – 2013.