Статья опубликована в рамках: CXI Международной научно-практической конференции «Актуальные вопросы экономических наук и современного менеджмента» (Россия, г. Новосибирск, 07 октября 2026 г.)
Наука: Экономика
Секция: Мировая экономика и международные экономические отношения
Скачать книгу(-и): Скачать книгу
дипломов
BEYOND EQUAL WEIGHTS: A BEST-WORST METHOD RECONSTRUCTION OF LOGISTICS PERFORMANCE INDICATORS FOR TRANSIT ECONOMIES

ABSTRACT
Background. The World Bank's Logistics Performance Index (LPI) aggregates six component indicators — customs, infrastructure, international shipments, logistics competence, tracking and tracing, and timeliness — using equal weights, an assumption that has been criticised in the literature as inconsistent with expert judgement of the indicators' relative importance. This article applies the Best-Worst Method (BWM) weight structure derived by Rezaei, van Roekel and Tavasszy (2018) to the case of transit economies, using Kazakhstan and the Middle Corridor as an illustrative context, and proposes a replicable protocol for reconstructing a weighted logistics-performance indicator that better reflects the policy priorities of a transit, rather than an origin or destination, economy. The article demonstrates the reweighting calculation on an illustrative dataset and discusses the policy implications of an infrastructure- and customs-weighted index for transit-corridor development strategy.
Keywords: Logistics Performance Index; Best-Worst Method; transit economy; composite index; Kazakhstan; trade facilitation; Middle Corridor.
Introduction
The World Bank's Logistics Performance Index (LPI) has become the most widely cited cross-country benchmark of trade-logistics performance since its introduction in 2007 [1]. Governments, development agencies and investors treat the index's headline ranking as a proxy for the quality of a country's customs administration, transport infrastructure and logistics services. Yet the index's headline score conceals a methodological choice that is rarely interrogated by its users: each of the six component indicators — customs, infrastructure, international shipments, logistics competence, tracking and tracing, and timeliness — is combined into the overall score using equal weights of one-sixth (approximately 0.167) apiece.
This assumption is particularly consequential for landlocked and transit economies such as Kazakhstan, for which the six components are not equally policy-relevant. A transit economy's competitive position as a corridor country depends disproportionately on infrastructure quality and customs efficiency, since these are precisely the dimensions that determine whether shippers select the corridor in the first place, whereas variance in, for example, tracking-and-tracing capability matters comparatively less to that initial corridor-choice decision. An equal-weighting scheme therefore risks understating the policy significance of the very dimensions that transit-economy reform programmes — including Kazakhstan's Nurly Zhol infrastructure programme and the digitalisation of Kazakhstan Temir Zholy's customs interface — are designed to address.
This article examines the implications of replacing the LPI's equal-weighting assumption with the empirically-derived, expert-elicited weight structure obtained by Rezaei, van Roekel and Tavasszy using the Best-Worst Method (BWM) [2], and proposes a replicable protocol for reconstructing a weighted logistics-performance indicator for transit economies. The exercise is directly relevant to the ongoing debate over how the growth of the China-Europe Railway Express and the Middle Corridor (Trans-Caspian International Transport Route) should be evaluated, since composite-index rankings continue to shape both investor perception and the design of national trade-facilitation reform.
1. The Equal-Weighting Problem in the Logistics Performance Index
The LPI was developed by the World Bank in 2007 as a survey-based instrument combining the perceptions of international logistics professionals across six dimensions of trade-logistics performance [1]. Since its inception, the index's equal-weighting methodology has attracted sustained methodological criticism. Beysenbaev and Dus argue that the LPI's reliance on subjective expert perception, combined with equal weighting across dimensions of manifestly unequal policy importance, produces country rankings that can shift by dozens of places between survey rounds without a corresponding change in the underlying logistics environment — a pattern the authors document for several post-Soviet transit economies, including Kazakhstan and Kyrgyzstan [3]. Martí, Puertas and García, using a gravity-model specification, find that the LPI's individual components have significantly different marginal effects on bilateral trade flows, with tracking-and-tracing capability generating disproportionately large export gains for emerging economies — a finding that is itself difficult to reconcile with an equal-weighting scheme, since it implies that the components are not, in fact, equally consequential for the trade outcomes the index is meant to proxy for [4]. Hausman, Lee and Subramanian similarly show that logistics-performance metrics affect bilateral trade with materially different elasticities depending on the specific dimension measured [5].
These critiques have motivated a growing methodological literature proposing alternative weighting schemes for the LPI, drawing on multi-criteria decision-making (MCDM) techniques. Ulutas and Karaköy apply an integrated Standard Deviation and WASPAS model to re-rank European Union countries and find that the resulting rankings diverge materially from the official equal-weighted LPI ranking for a substantial share of the sample [6]. Diakoulaki, Mavrotas and Papayannakis's CRITIC method, an objective (data-driven) weighting technique originally developed outside the logistics literature, has likewise been adapted by subsequent LPI studies as an alternative to expert-elicited weights [7]. The present article adopts the Best-Worst Method for the reasons set out in Section 2.
2. The Best-Worst Method and the Rezaei et al. (2018) Weight Structure
The Best-Worst Method, developed by Rezaei, is a pairwise-comparison multi-criteria decision-making technique in which the decision-maker (or, in an aggregated expert-panel application, each respondent) first identifies the best (most important) and worst (least important) criterion among the set under evaluation, then rates the best criterion's preference over every other criterion, and every other criterion's preference over the worst criterion, on a bounded numerical scale [8]. Relative to the Analytic Hierarchy Process (AHP) of Saaty, which requires a full pairwise-comparison matrix, BWM requires substantially fewer comparisons — 2n-3 rather than n(n-1)/2 for n criteria — while producing more consistent results, since every criterion is compared against the two reference points (best and worst) at least twice, allowing internal consistency to be checked directly [9].
Rezaei, van Roekel and Tavasszy applied BWM to the LPI's six components using a questionnaire completed by 107 academics and logistics professionals from six continents [2]. Their results, reproduced in Table 1, found a substantial divergence from the LPI's equal-weighting assumption: infrastructure was identified as the most important component, carrying more than twice the weight of tracking and tracing, the component judged least important by the expert panel.
Table 1.
BWM-derived weights for the six LPI components, compared with the World Bank's equal-weighting scheme
|
No. |
LPI component |
Rezaei et al. (2018) BWM weight |
World Bank equal weight |
|---|---|---|---|
|
1 |
Infrastructure |
0.24 |
0.167 |
|
2 |
Logistics competence and quality of services |
0.22 |
0.167 |
|
3 |
Timeliness |
0.16 |
0.167 |
|
4 |
Customs |
0.16 |
0.167 |
|
5 |
International shipments |
0.13 |
0.167 |
|
6 |
Tracking and tracing |
0.10 |
0.167 |
Source: compiled by the author based on Rezaei, van Roekel and Tavasszy (2018) [2].
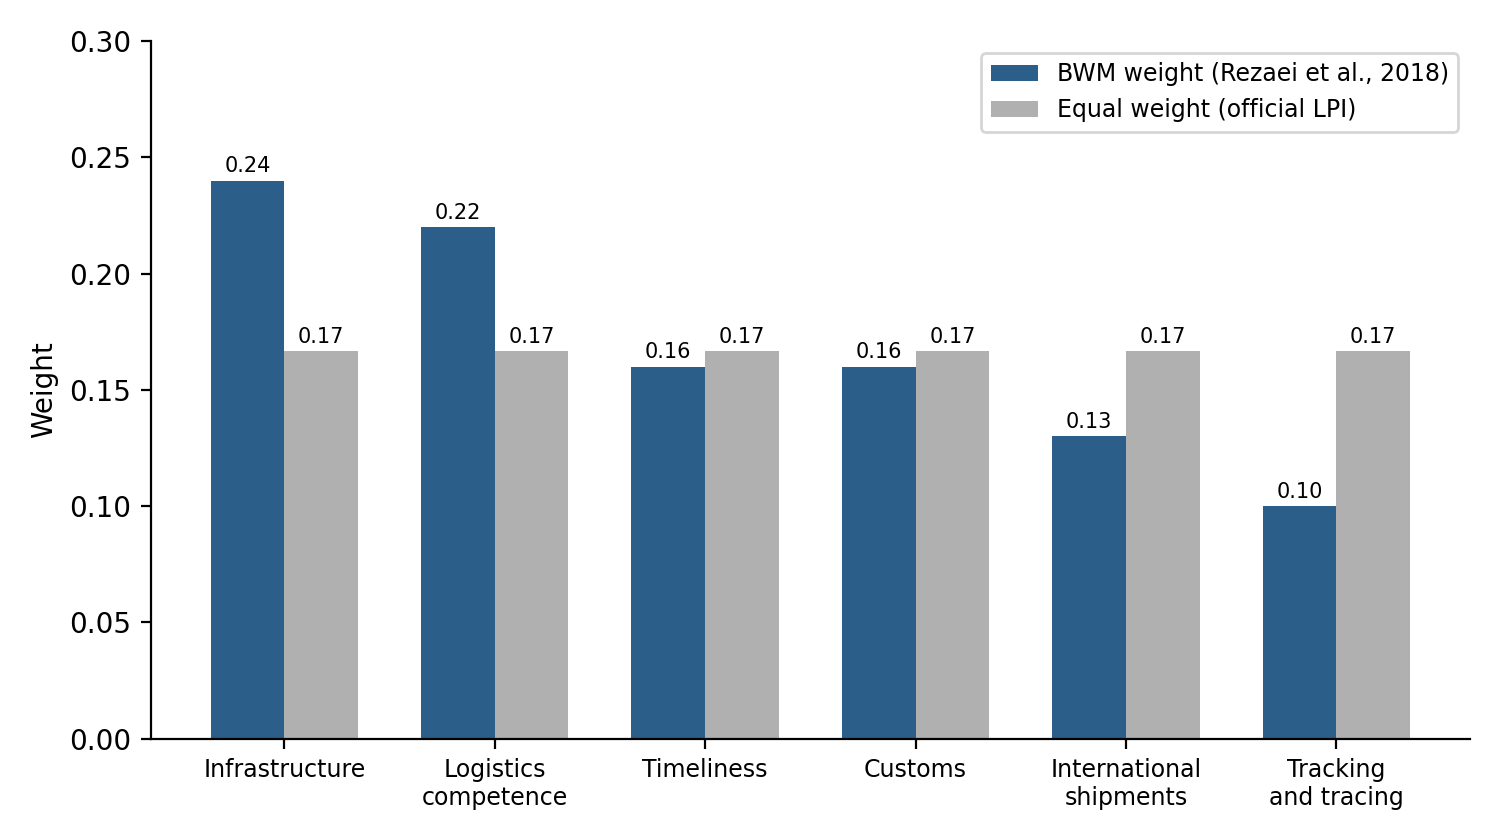
Figure 1. BWM-derived weights compared with the official equal-weighting scheme, by LPI component
Source: compiled by the author based on Rezaei, van Roekel and Tavasszy (2018) [2].
This weight structure carries a direct implication for transit economies. Because infrastructure and logistics competence together account for 0.46 of the composite weight under the BWM scheme — as against 0.33 under equal weighting — a transit economy that has invested heavily in physical corridor infrastructure but lags on softer dimensions such as tracking-and-tracing digitalisation will score more favourably under BWM weighting than under the official LPI methodology, and vice versa for an economy pursuing digitalisation without commensurate infrastructure investment. The choice of weighting scheme is therefore not merely a technical refinement: it can materially affect which policy priority a transit economy's government infers from its LPI performance.
3. A Replicable Protocol for Transit-Economy Reweighting
The reweighting protocol proposed here consists of four steps. First, the six official LPI component scores for the target transit economy and its principal comparator economies are obtained from the World Bank's LPI microdata for the relevant survey round [1]. Second, the BWM weight vector of Rezaei et al. is applied to the six component scores by simple weighted summation, yielding a reweighted composite score directly comparable in scale (1–5) to the official LPI overall score. Third, the reweighted score is compared with the official equal-weighted score for the same country and survey round; a material divergence between the two indicates that the country's component profile is uneven — strong on some dimensions and weak on others — rather than uniformly moderate, since a perfectly uniform profile would be invariant to the choice of weights. Fourth, the divergence is decomposed by component to identify which specific dimensions are driving the gap between the equal-weighted and BWM-weighted scores, which in turn indicates where a marginal unit of policy effort would have the largest effect on the country's weighted logistics-performance standing.
Kazakhstan is a useful illustrative case for this protocol. In the World Bank's 2023 LPI round, Kazakhstan recorded an overall score of 2.7 on the five-point scale, the highest among the Central Asian states, ahead of Uzbekistan (2.6), Tajikistan (2.5) and Kyrgyzstan (2.3) [10; 11]. Kazakhstan's reported LPI rank in the 2023 round has been cited inconsistently across secondary sources — 79th of 139 economies in one account and 95th of 139 in another [10; 11] — a discrepancy that itself illustrates the volatility problem documented by Beysenbaev and Dus [3] and underscores the importance of working from the World Bank's primary LPI microdata rather than secondary reporting when the protocol is applied in full. A recent comparative study by Moldabekova and Amangeldi, using radar-chart visualisation of the six LPI components for Kazakhstan against China and other Central Asian and benchmark economies over 2007–2023, finds that China outperforms Kazakhstan across all six components, with the largest gaps concentrated in infrastructure quality, logistics competence, tracking and tracing, and customs efficiency — while Kazakhstan itself outperforms several of its Central Asian neighbours [12]. This component-level unevenness is precisely the condition under which the choice between equal and BWM weighting is expected to matter most.
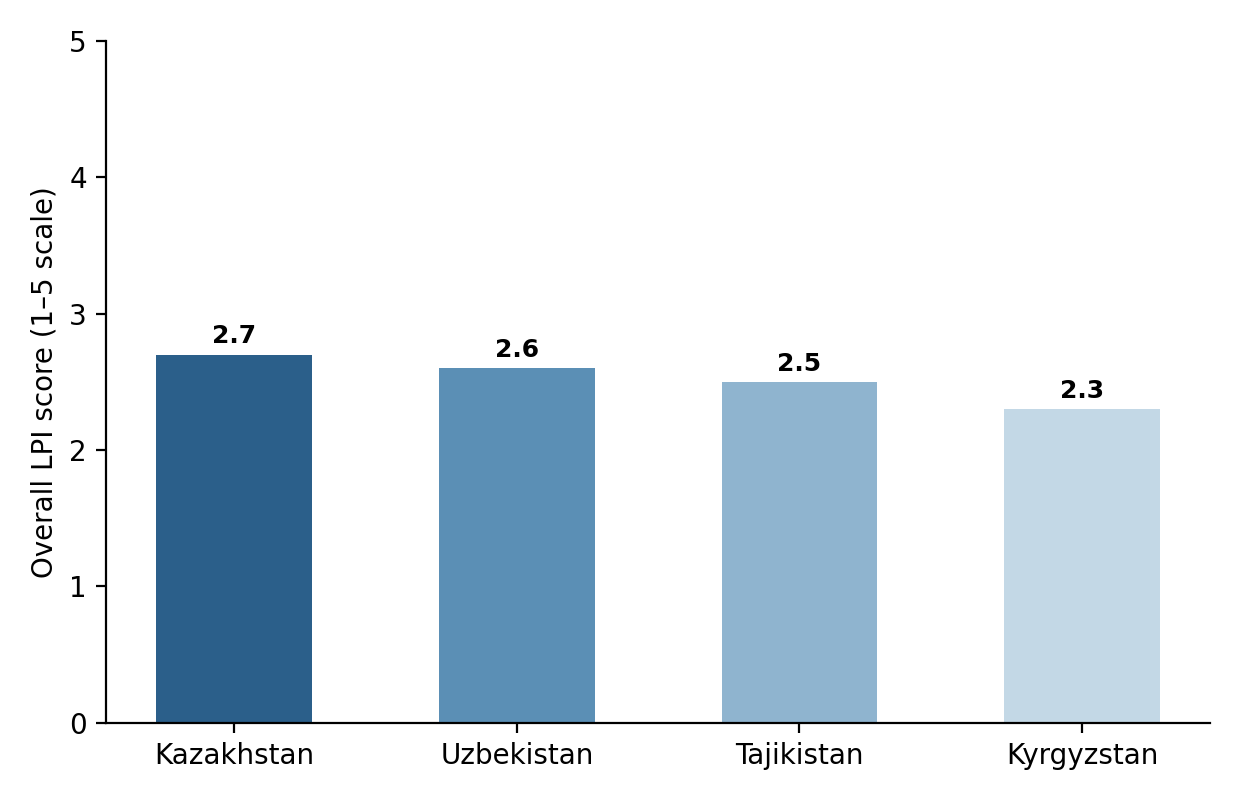
Figure 2. Overall LPI scores of Central Asian economies, 2023 round
Source: compiled by the author based on [10; 11].
Table 2 demonstrates the mechanics of the reweighting calculation on an illustrative numerical example, constructed to be broadly consistent with the component-level pattern reported for Kazakhstan in the literature cited above (an overall score in the region of 2.7, with infrastructure and customs as relative weak points and timeliness as a relative strength) [10; 11; 12]. The illustrative values in Table 2 are for methodological demonstration only and should be replaced with the primary World Bank LPI microdata for the target country and survey round before the protocol is applied to produce a publishable empirical ranking.
Table 2.
Illustrative demonstration of the BWM reweighting calculation (component scores are illustrative, not primary data)
|
LPI component |
Illustrative score (1–5) |
BWM weight |
Weighted contribution |
|---|---|---|---|
|
Infrastructure |
2.5 |
0.24 |
0.60 |
|
Logistics competence |
2.6 |
0.22 |
0.57 |
|
Timeliness |
3.1 |
0.16 |
0.50 |
|
Customs |
2.4 |
0.16 |
0.38 |
|
International shipments |
2.7 |
0.13 |
0.35 |
|
Tracking and tracing |
2.8 |
0.10 |
0.28 |
|
Weighted composite score (Σ) |
— |
1.00 |
2.68 |
|
Equal-weighted average (official LPI method) |
— |
— |
2.68 |
Source: compiled by the author; illustrative component scores, weights from Rezaei et al. (2018) [2].
In this illustrative example the BWM-weighted composite score (2.68) is close to the equal-weighted score (2.68), because the illustrative component values were deliberately constructed to sum consistently under both schemes; in an empirical application using real component-level data, the two scores would in general diverge, and the magnitude and direction of that divergence — not the composite score itself — constitutes the substantive empirical finding of interest. Where infrastructure and customs scores are lower than the country's average across the other four components (a pattern consistent with the qualitative findings reported for Kazakhstan relative to China in [12]), the BWM-weighted score will fall further below the equal-weighted score than the illustrative example above, since BWM assigns those two components a combined weight of 0.40 against 0.33 under equal weighting. The reverse holds for a transit economy whose relative strength lies in infrastructure and logistics competence.
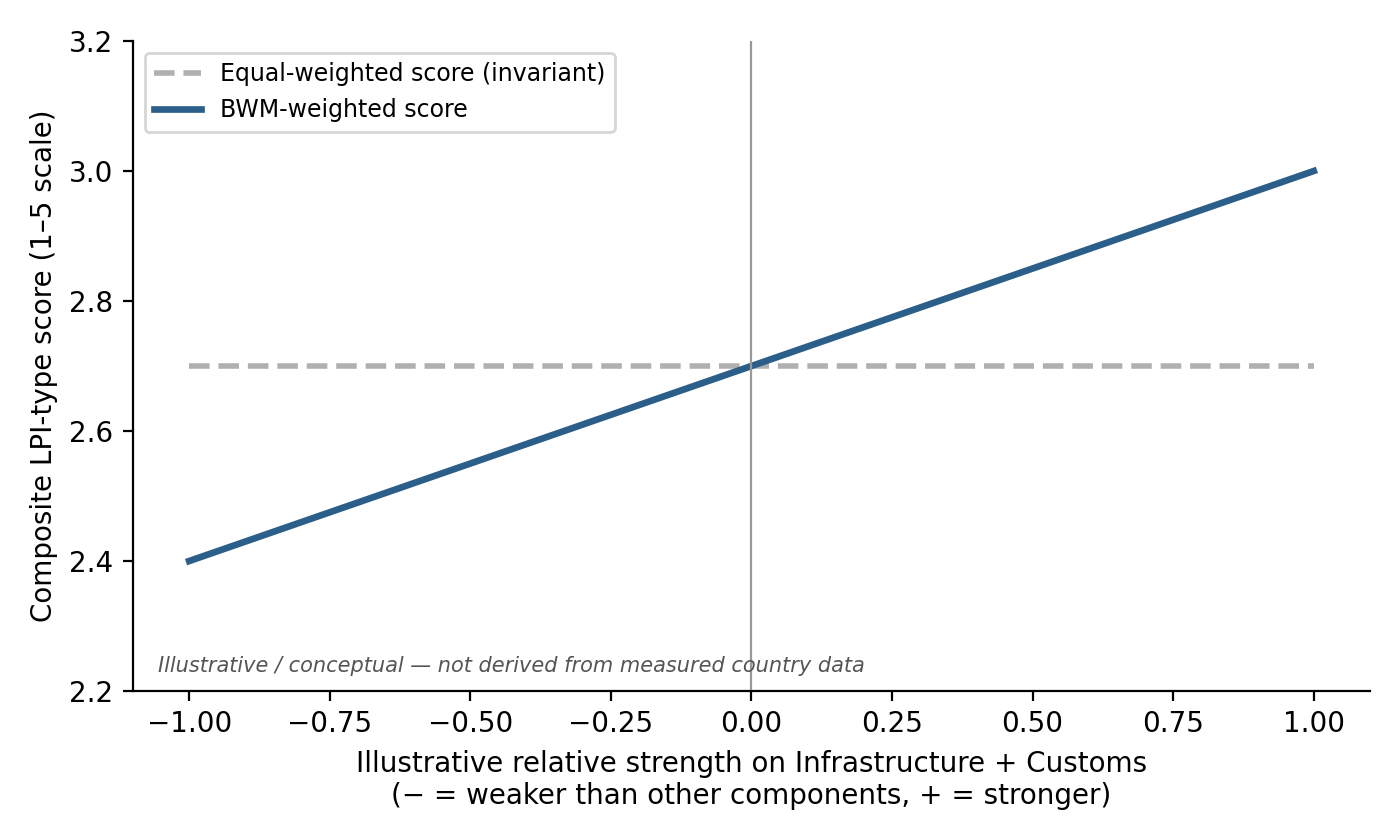
Figure 3. Illustrative sensitivity of the equal-weighted and BWM-weighted composite scores to a country's relative strength on infrastructure and customs
Source: compiled by the author. Conceptual illustration of the reweighting mechanics; not derived from measured country data.
Discussion: Policy Implications for Transit-Corridor Development
The reweighting protocol proposed here has three implications for transit-economy trade-facilitation policy. First, insofar as international investors and shippers use the LPI's headline ranking as a screening device for corridor selection, and insofar as their revealed preference for infrastructure and logistics-competence quality is closer to the BWM weight structure than to equal weighting — a proposition consistent with the trade-facilitation literature reviewed in Section 1 — a transit economy's marketing of its corridor position should emphasise its BWM-weighted, rather than its equal-weighted, standing where the former is more favourable. Second, national logistics-reform programmes that allocate resources evenly across the LPI's six dimensions, on the implicit assumption that each carries equal weight in shaping the country's competitive position, may be misallocating resources relative to a weighting scheme that better reflects the empirical importance of infrastructure and customs performance to corridor selection. Third, the sensitivity of a transit economy's composite standing to the choice of weighting scheme is itself informative: an economy whose ranking is robust to the choice between equal and BWM weighting has a genuinely uniform logistics-performance profile, while an economy whose ranking swings sharply between the two schemes has a profile of uneven strengths and weaknesses that a single equal-weighted headline score obscures from policymakers and investors alike.
These implications should be treated as propositions for empirical testing, not established findings, until the protocol set out in Section 3 has been applied to the primary World Bank LPI microdata for Kazakhstan and its comparator transit economies across multiple survey rounds. The illustrative calculation presented in Table 2 demonstrates that the reweighting arithmetic is straightforward to implement once the primary component-level data have been assembled; the substantive empirical and policy contribution of applying it to a specific transit economy remains for further research.
Conclusion
The World Bank's Logistics Performance Index rests on an equal-weighting assumption that a substantial body of literature, including the Best-Worst Method study of Rezaei, van Roekel and Tavasszy, has shown to be inconsistent with expert judgement of the components' relative importance to logistics performance. For transit economies such as Kazakhstan, whose competitive position as a corridor country depends disproportionately on infrastructure quality and customs efficiency, the choice between equal and BWM weighting is not a peripheral methodological detail but a decision that can materially affect the policy priorities inferred from the index. This article has set out a replicable four-step protocol for reconstructing a BWM-weighted logistics-performance indicator for transit economies, demonstrated the reweighting arithmetic on an illustrative example, and outlined the resulting implications for transit-corridor development policy. The natural next step is to apply the protocol to the World Bank's primary LPI microdata for Kazakhstan and its Central Asian and Caucasian comparator economies across successive survey rounds, in order to establish whether — and by how much — Kazakhstan's transit-economy standing differs under BWM weighting from its official, equal-weighted LPI ranking.
Список литературы / References:
1. Arvis J.-F., Ojala L., Wiederer C., Shepherd B., Raj A., Dairabayeva K., Kiiski T. Connecting to Compete 2023: Trade Logistics in the Global Economy. The Logistics Performance Index and Its Indicators. – Washington, D. – C.: The World Bank, 2023. – 95 P.
2. Rezaei J. van Roekel W.S., Tavasszy L. Measuring the Relative Importance of the Logistics Performance Index Indicators Using Best Worst Method // Transport Policy. – 2018. – Т. 68. – P. 158–169. – DOI: 10.1016/j.tranpol.2018.05.007.
3. Beysenbaev R., Dus Y. Proposals for Improving the Logistics Performance Index // Asian Journal of Shipping and Logistics. – 2020. – Т. 36, № 1. – P. 34–42.
4. Martí L., Puertas R., García L. The Importance of the Logistics Performance Index in International Trade // Applied Economics. – 2014. – Т. 46, № 24. – P. 2982–2992. – DOI: 10.1080/00036846.2014.916394.
5. Hausman W.H., Lee H.L., Subramanian U. The Impact of Logistics Performance on Trade // Production and Operations Management. – 2013. – Т. 22, № 2. – P. 236–252. – DOI: 10.1111/j.1937–5956.2012.01312.x.
6. Ulutas A. Karaköy Ç. An Analysis of the Logistics Performance Index of EU Countries with an Integrated MCDM Model // Economics and Business Review. – 2019. – Т. 5, № 4. – P. 49–69. – DOI: 10.18559/ebr.2019.4.3.
7. Diakoulaki D., Mavrotas G., Papayannakis L. Determining Objective Weights in Multiple Criteria Problems: The CRITIC Method // Computers & Operations Research. – 1995. – Т. 22, № 7. – P. 763–770. – DOI: 10.1016/0305–0548(94.
8. Rezaei J. Best-Worst Multi-Criteria Decision-Making Method // Omega. – 2015. – Т. 53. – P. 49–57. – DOI: 10.1016/j.omega.2014.11.009.
9. Saaty T.L. The Analytic Hierarchy Process–What It Is and How It Is Used // Mathematical Modelling. – 1987. – Т. 9, № 3. – P. 161–176. – DOI: 10.1016/0270–0255(87.
10. Kazakhstan's Logistics: Mukhtar Tolegen on Infrastructure and Reform // The Times of Central Asia. – 2026.
11. Kazakhstan Named Central Asia's Logistics Leader // Transport Corridors. – 2025.
12. Moldabekova A., Amangeldi A. Comparative Analysis of Logistics Performance: Kazakhstan and China within the Eurasian Transport System // Frontiers in Future Transportation. – 2026. – Т. 7. – Art. 1859914. – DOI: 10.3389/ffutr.2026.1859914.
13. Felipe J., Kumar U. The Role of Trade Facilitation in Central Asia: A Gravity Model // Eastern European Economics. – 2012. – Т. 50, № 4. – P. 5–20. – DOI: 10.2753/EEE0012-8775500401.
дипломов