
Статья опубликована в рамках: CXI Международной научно-практической конференции «Актуальные вопросы экономических наук и современного менеджмента» (Россия, г. Новосибирск, 07 октября 2026 г.)
Наука: Экономика
Секция: Операционный менеджмент
Скачать книгу(-и): Скачать книгу
дипломов
MULTI-STAGE STRATIFIED SAMPLING FOR AGING-SERVICES RESEARCH: DESIGNING A REPRESENTATIVE SURVEY FRAMEWORK FOR AN INTEGRATED SERV-SPO-CSI MODEL OF ELDERLY CARE SATISFACTION IN SHANXI, CHINA

ABSTRACT
Background. Structural equation modeling (SEM) of elderly-care service quality and satisfaction places two competing demands on the underlying sample: it must be large enough to support stable estimation of a multi-construct measurement and structural model, and it must be representative of the subgroups — urban versus rural residents, and recipients of home-based, community, and institutional care — across which the model's moderating hypotheses are to be tested. This article examines how a multi-stage stratified sampling design can satisfy both demands simultaneously in the context of an empirical study of the SERV-SPO-CSI integrated model of elderly-care satisfaction in Shanxi Province, China. Methods. The article combines a review of established sampling theory and SEM sample-size guidance with the sampling protocol developed for the Shanxi study, examining how stratification variables, recruitment channels, and data-quality screening criteria were derived from the study's specific constraints — a 35–40-item instrument, a minimum stable-fit threshold of approximately 500 cases, and a target of no fewer than 600 valid responses. Results. The analysis yields a two-stage stratification framework — geography (urban community versus rural village) at the first stage and service type (home-based, community day-center, and public or private residential institution) at the second — together with proportional-allocation logic for distributing the target sample across strata, recruitment channels tied to each stratum, and explicit criteria for excluding low-quality questionnaires. A Cochran's-formula calculation with a conservative design-effect adjustment for institution-level clustering independently confirms that a target of approximately 580 valid responses is required for 95 percent confidence at a 5 percent margin of error, consistent with the study's adopted 600-case target, and a review of three recently published SEM-based elderly-care satisfaction studies in China — including one conducted in Shanxi Province — shows that instruments of comparable or smaller scope have reliably achieved reliability coefficients above 0.80 and RMSEA values below 0.05 at comparable or smaller sample sizes. Conclusion. A multi-stage stratified design is not a peripheral procedural detail but a structural precondition for the moderation analysis the SERV-SPO-CSI model is intended to support; without it, the planned urban-rural and service-type comparisons would rest on subsamples of unknown and likely unequal representativeness.
Keywords: multi-stage sampling; stratified sampling; sample size determination; structural equation modeling; survey representativeness; elderly care; urban–rural disparities; China.
Introduction
China's elderly-care system is organized around the “9073” pattern, under which roughly ninety percent of older adults age at home, a smaller share rely on community-based day services, and the remainder reside in institutions. This distribution is not uniform across the country: home-based and community services are documented to be more developed in urban areas, while rural regions face shortages of both facilities and trained care staff, and institutional care itself spans a heterogeneous range from means-tested public welfare institutions to private and public-private-partnership facilities with markedly different price points and service standards. An empirical model that seeks to explain elderly-care satisfaction across this landscape, and to test whether the structural drivers of satisfaction differ between urban and rural residents or across service types, depends entirely on a sample that reflects this heterogeneity rather than concentrating, as convenience samples often do, on the residents of one or two accessible institutions in a single city.
The objective of this article is twofold: first, to set out the methodological principles — drawn from sampling theory and from established guidance on sample size for structural equation modeling — that should govern the design of a survey intended to support a multi-construct, multi-group SEM analysis; and second, to present and justify the multi-stage stratified sampling framework developed for an empirical study of the SERV-SPO-CSI integrated model of elderly-care satisfaction in Shanxi Province, including its stratification variables, its recruitment channels, and its data-quality screening criteria.
Theoretical Framework
Sampling theory distinguishes simple random sampling, in which every population element has an equal and independent chance of selection, from stratified sampling, in which the population is first divided into homogeneous subgroups (strata) and elements are then sampled within each stratum, and from multi-stage sampling, in which sampling proceeds through a sequence of nested units (for example, region, then locality, then individual) rather than directly from a single population list [1]. Stratification is preferred whenever a study's analytic goals include comparing identifiable subgroups, because it guarantees a minimum number of cases in each subgroup regardless of that subgroup's share of the overall population, whereas a simple random or convenience sample can leave a small subgroup underrepresented or absent entirely.
A second body of guidance concerns the sample size required for stable SEM estimation. Widely cited rules of thumb include a minimum of ten respondents per estimated parameter or per manifest item, an absolute floor in the range of 200 to 500 cases regardless of model complexity, and evidence that model fit indices stabilize and standard errors shrink to acceptable levels once sample size reaches approximately 500 for models of moderate complexity [2, 3, 4]. These guidelines interact with, rather than substitute for, stratification: a stratified design that under-samples a comparison subgroup relative to what multi-group invariance testing requires will fail to support that testing even if the total sample size is nominally adequate.
Three propositions follow. P1: a single-stage convenience or simple random sample cannot reliably guarantee the subgroup balance that multi-group SEM invariance testing across urban and rural residence, or across service type, requires. P2: a multi-stage design that stratifies first by geography and then by service type produces subsamples large enough to support separate group-level models while keeping total sample size within the range that SEM estimation requires for stable global fit. P3: the number of manifest items in the measurement instrument sets a floor on total sample size that must be reconciled with, rather than treated independently of, the stratification design, since finer stratification increases the number of cells that must each remain adequately populated.
Materials and Methods
This article applies a design-analysis method: it maps established sampling and SEM sample-size literature onto the specific parameters of the Shanxi elderly-care satisfaction study, rather than analyzing already-collected survey data. The instrument under consideration comprises 35 to 40 substantive items distributed across structural, process, and outcome constructs; applying the sample-size guidance reviewed above, this item count implies a floor in the range of 350 to 500 cases for stable measurement-model estimation, and the study accordingly sets a working minimum of approximately 500 valid cases for stable structural-model fit and a target of no fewer than 600 valid responses to allow for the exclusion of an anticipated share of low-quality questionnaires.
The sampling design proceeds in two stages. At the first stage, the sampling frame is stratified geographically into urban community and rural village strata, reflecting documented disparities in service availability, staffing, and infrastructure between urban and rural elderly-care provision. At the second stage, within each geographic stratum, the frame is further stratified by service type into three categories: home-based care recipients, users of community day-care centers, and residents of public or private residential institutions. This two-stage structure directly mirrors the moderating variables specified in the study's planned analysis, which calls for a multi-group structural equation model comparing urban and rural subsamples on the paths linking structural antecedents, perceived service quality, and satisfaction.
Recruitment channels are tied to each stratum and service type: home-based care recipients and community day-center users are recruited through elderly-care institutions, community residents' committees, and community health service centers; rural respondents are additionally recruited through village committees and township health clinics; and residential-institution respondents are recruited on-site with the cooperation of institution management, who are also invited to complete a short institution-level questionnaire and, where feasible, a semi-structured interview covering service processes, operational challenges, and policy implementation — information that a standardized elderly-respondent questionnaire cannot capture. All respondents are read an informed-consent statement prior to participation, confirming that data will be used for academic research only and that participation is voluntary.
Data-quality screening is applied after collection and before analysis, following three exclusion criteria established in the study protocol: questionnaires with more than 20 percent missing content are excluded; questionnaires exhibiting patterned, non-differentiated responding (for example, selecting the same scale point, such as “3,” across all items) are excluded; and questionnaires containing internal logical contradictions (for example, a respondent who indicates having never received elderly-care services but nonetheless rates satisfaction with such services) are excluded. Retained data are further screened for normality using the Kolmogorov-Smirnov test, with logarithmic or square-root transformation applied where the assumption of approximate normality required by SEM estimation is not met.
Results
Applying this framework yields a sampling structure with six primary cells: home-based, community day-center, and institutional respondents, crossed with urban and rural geography. Table 1 presents this structure together with an illustrative proportional-allocation logic; because the precise current distribution of Shanxi's elderly population across these six cells was not available in the sources consulted for this article, the allocation shown should be treated as a template to be finalized against the most recent statistics published by the Shanxi provincial and Taiyuan municipal civil affairs bureaus, rather than as a fixed final quota. Figure 1 presents this structure and its illustrative cell allocation graphically.
Table 1.
Illustrative multi-stage stratification structure for a target of 600 valid responses
|
Stratum 1 → |
Home-based care |
Community day-center |
Institutional care |
Row total |
|
Urban community |
130 |
85 |
85 |
300 |
|
Rural village |
130 |
85 |
85 |
300 |
|
Column total |
260 |
170 |
170 |
600 |
Note: cell counts are an illustrative allocation, to be finalized against current Shanxi / Taiyuan civil-affairs statistics; minimum cell size = 85; total N = 600 valid responses.
Within this structure, allocation across the six cells should be weighted toward home-based care in both geographic strata, consistent with the “9073” pattern in which home-based care accounts for the large majority of elderly-care recipients nationally, while still reserving a minimum floor per cell (a commonly used threshold in multi-group SEM practice is no fewer than 100–150 cases per group) sufficient to support separate group-level model estimation for the planned urban-rural invariance test.

Figure 1. Two-stage stratification structure and illustrative cell allocation (N ≈ 600)
Stage 1 stratifies by geography (urban / rural); Stage 2 stratifies each geographic stratum by service type (home-based / community / institutional). Cell counts shown are an illustrative allocation weighted toward home-based care, consistent with China's "9073" elderly-care pattern; to be finalized against current Shanxi / Taiyuan civil-affairs population statistics.
Applying the 20-percent-missing, patterned-response, and logical-contradiction exclusion criteria to a nominal gross sample somewhat above the 600-case target (accounting for an anticipated invalid-response rate in face-to-face elderly surveys in the range of 10 to 15 percent, based on the rates reported for comparable elderly-population surveys) is expected to yield a net valid sample at or above the study's 600-case target, though the precise invalid-response rate can only be established once fieldwork begins.
A Priori Sample-Size Justification: Cochran's Formula and Design-Effect Adjustment
To place the study's working sample-size target on a formal statistical footing rather than relying on rule-of-thumb SEM guidance alone, a base sample size was first calculated using Cochran's formula for estimating a population proportion at a specified confidence level and margin of error: n0 = Z²p(1-p)/e² [10]. Using a 95 percent confidence level (Z = 1.96), the conservative assumption of maximum variance (p = 0.5), and a 5 percent margin of error (e = 0.05), this yields n0 = (1.96² × 0.5 × 0.5) / 0.05² ≈ 384 respondents, the standard base figure for a simple random sample of this precision from a large population.
Because the proposed design recruits respondents through institutions and localities rather than sampling individuals directly from a population register, a design effect (deff) adjustment is required to account for the reduced statistical efficiency introduced by this clustering. Applying a conservative deff of 1.5 — within the 1.2–2.0 range typically reported for multi-stage cluster and institution-based survey designs [1] — raises the required sample to n = 384 × 1.5 ≈ 577, which rounds to approximately 580 valid responses. This calculation independently corroborates, rather than merely restates, the study's adopted target of no fewer than 600 valid responses, since 600 exceeds the 580-case statistical minimum by a margin sufficient to absorb modest further clustering or subgroup-level precision loss. Reconciling this net target with the 10–15 percent invalid-response rate anticipated for face-to-face elderly surveys implies a gross fielded sample of approximately 650 to 680 questionnaires to reliably net at least 580–600 valid cases. Figure 2 summarizes this derivation step by step.
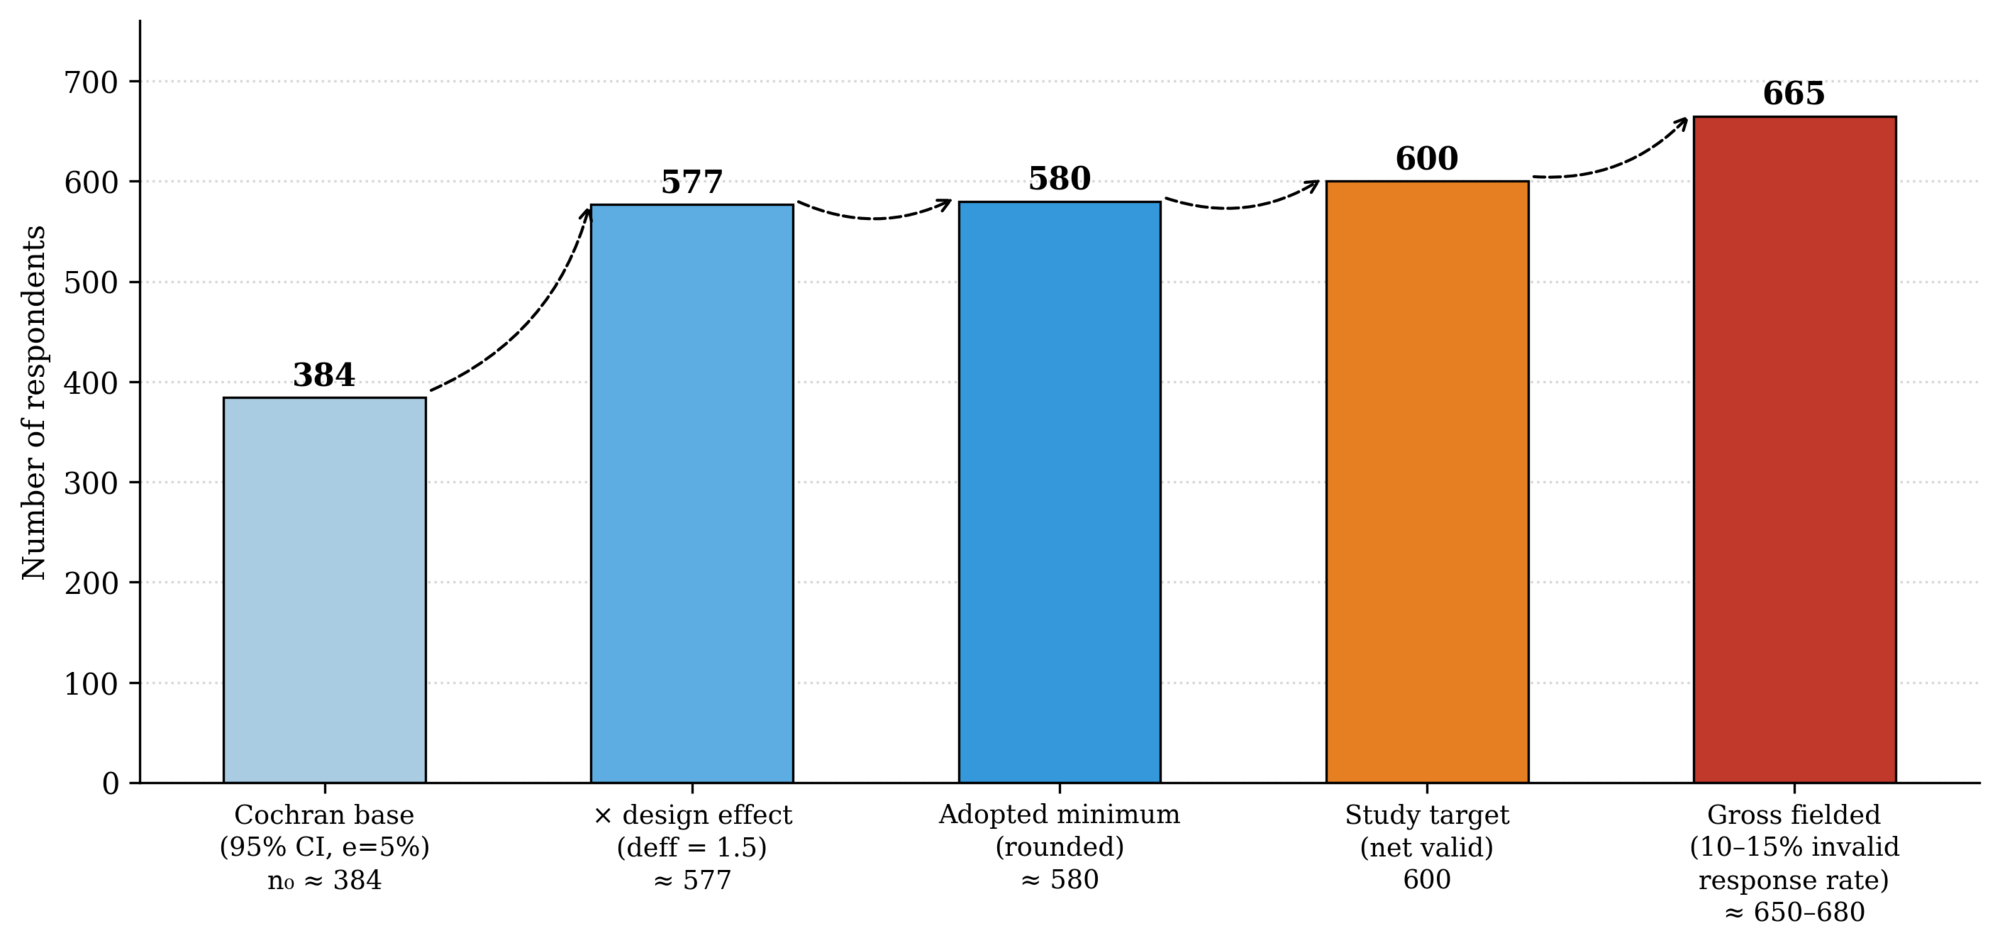
Figure 2. Derivation of the target sample size: Cochran’s formula, design-effect adjustment, and gross fielding target
Benchmarking Against Published Elderly-Care SEM Studies in China
A second, complementary form of justification asks whether instruments and sample sizes of the scale proposed here have, in practice, delivered adequate reliability and model fit when applied to elderly respondents in China. Three recent studies are informative. Ding et al. surveyed 1,004 elderly service recipients in Chongqing using a multi-stage stratified random sampling method — the same design logic proposed in this article — and reported an overall institutional-satisfaction Cronbach's alpha of 0.905, with subdimension alphas of 0.824 and 0.878, comfortably above the conventional 0.70 reliability threshold [11]. Shan et al. applied the Customer Satisfaction Index model — the same theoretical tradition incorporated into the outcome layer of the SERV-SPO-CSI framework — to a five-latent-variable, sixteen-observed-variable structural model of nursing-home satisfaction among urban Chinese elderly residents, demonstrating that the CSI approach is estimable and interpretable with elderly Chinese respondents at sample sizes well within the range targeted here [12]. Liu et al., in a study conducted in Shanxi Province itself alongside Zhejiang and Chongqing, developed a 29-item patient-reported questionnaire for older adults using confirmatory factor analysis, reporting Cronbach's alpha coefficients of 0.899 and 0.906, RMSEA values of 0.02–0.03, GFI values of 0.97, and standardized factor loadings ranging from 0.50 to 0.94 [13].
Read together, these three studies show that instruments of comparable item count (16 to 29 substantive items) and comparable or smaller sample size than the roughly 600 targeted here have reliably achieved reliability coefficients above 0.80 and RMSEA values below 0.05 among Chinese elderly respondents, including in Shanxi Province specifically. This benchmarking evidence does not substitute for the SERV-SPO-CSI model's own empirical validation, which has not yet been conducted and requires the fieldwork this article's sampling design is intended to support; rather, it indicates that the proposed instrument scope and sample size fall within the range in which comparable elderly-care instruments in this setting have consistently performed well, substantially reducing the a priori risk that the design is statistically underpowered. Figure 3 presents these reliability coefficients graphically against the conventional acceptability threshold.
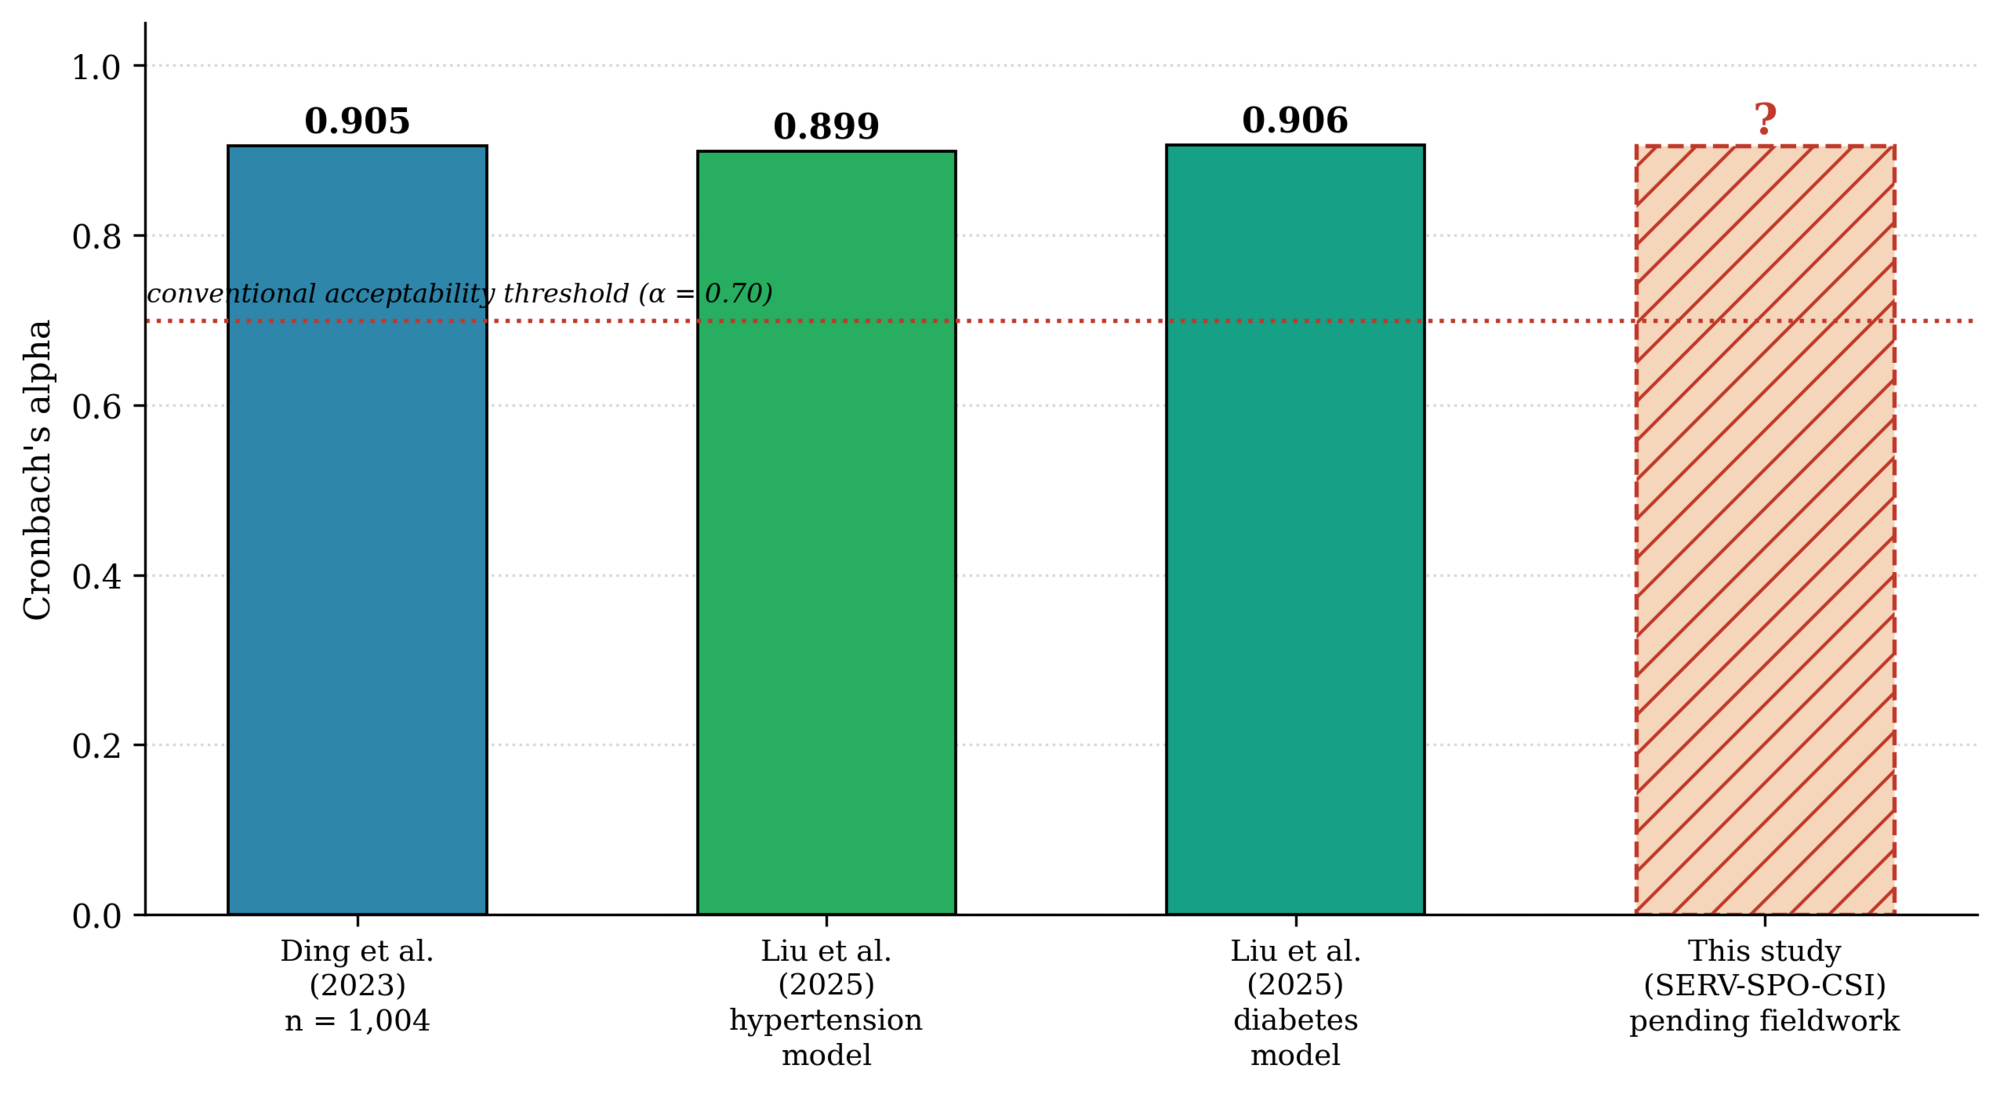
Figure 3. Reported reliability (Cronbach’s alpha) in comparable published elderly-care SEM/questionnaire studies in China, benchmarked against the conventional 0.70 threshold
Discussion
The multi-stage stratified design addresses Proposition P1 directly: by fixing minimum cell sizes at the design stage rather than leaving subgroup representation to chance, it removes the risk that the urban or rural subsample, or any single service type, ends up too small to support the multi-group invariance testing that is central to the SERV-SPO-CSI model's moderation hypotheses. It also operationalizes Proposition P2, since the six-cell structure keeps the overall target sample within the 500–600 range that SEM guidance suggests is adequate for a model of this complexity, while ensuring that no cell is trivially small.
The benchmarking evidence presented above reinforces this conclusion from a different angle: because comparable Chinese elderly-care SEM and questionnaire-validation studies — including one fielded in Shanxi Province itself — have achieved strong reliability and fit statistics at sample sizes at or below the target proposed here, the risk that the SERV-SPO-CSI design is either statistically underpowered or methodologically untested in this population and region is substantially reduced, even though the model's own empirical performance remains to be established through the planned fieldwork rather than assumed in advance.
Three limitations qualify the design. First, reliance on institutional gatekeepers — elderly-care institution managers, community residents' committees, and village committees — for respondent access introduces a risk of selection bias toward more cooperative institutions and toward residents whom staff consider capable of completing an interview, potentially underrepresenting the most frail or cognitively impaired elderly residents. Second, because respondents are recruited through institutions and localities rather than sampled individually from a population register, the effective sample size may be smaller than the nominal count suggests, owing to within-institution clustering (a design effect); this can be partially addressed at the analysis stage by reporting design-adjusted standard errors where institution-level clustering is significant. Third, face-to-face administration — necessary given the literacy, vision, and stamina constraints common among elderly respondents — is considerably more time- and resource-intensive than self-administered or online data collection, which constrains how large a gross sample can practically be fielded within the study's timeline and budget.
Conclusion
This article has argued that sampling design for SEM-based elderly-care research is not a peripheral procedural choice but a structural precondition for the analyses such studies are meant to support. A two-stage stratified design — geography at the first stage, service type at the second — combined with stratum-linked recruitment channels and explicit data-quality screening criteria, translates the abstract requirement of “representativeness” into a concrete, replicable procedure capable of delivering the roughly 600 valid, subgroup-balanced responses that the SERV-SPO-CSI model's planned multi-group structural equation analysis requires. The principal contribution of the article is to make explicit the link between an instrument's item count, the sample-size thresholds that SEM estimation requires, and the stratification structure needed to support planned subgroup comparisons — a link that is often left implicit, and consequently under-designed, in applied elderly-care satisfaction research.
References:
- Kish L. Survey Sampling. – New York: John Wiley & Sons, 1965.
- Kline R.B. Principles and Practice of Structural Equation Modeling. – 4th ed. – New York: Guilford Press, 2015.
- Hair J.F., Black W.C., Babin B.J., Anderson R.E. Multivariate Data Analysis. – 8th ed. – Andover: Cengage Learning, 2019.
- Bentler P.M., Chou C.-P. Practical Issues in Structural Modeling // Sociological Methods & Research. – 1987. – Vol. 16, No. 1. – P. 78–117.
- Donabedian A. Evaluating the Quality of Medical Care // The Milbank Memorial Fund Quarterly. – 1966. – Vol. 44, No. 3. – P. 166–206.
- Law of the People's Republic of China on the Protection of the Rights and Interests of the Elderly (as amended). – Standing Committee of the National People's Congress, 1996–2018.
- 14th Five-Year Plan for the Development of National Aging Programs and the Elderly Care Service System. – State Council of the People's Republic of China, 2022.
- Opinions on Advancing the Construction of the Basic Elderly Care Service System. – General Office of the Communist Party of China Central Committee and General Office of the State Council, 2023.
- Kenzhetay M. SERV-SPO-CSI Integrated Model: Empirical Research Design Protocol (unpublished project document). – Al-Farabi Kazakh National University, 2026.
- Cochran W.G. Sampling Techniques. — 3rd ed. — New York: John Wiley & Sons, 1977.
- Ding S., Liu G., Xu F., Ji K., Zhao L., Zheng X., Benjamin O., Wang Z., Yang S., Chen R. The Satisfaction of Elderly People with Elderly Caring Social Organizations and Its Relationship with Social Support and Anxiety during the COVID-19 Pandemic: A Cross-Sectional Study // BMC Public Health. — 2023. — Vol. 23. — Art. 1206.
- Shan S., Sun Z., Zhang F., Zhang R., Yang B. Have Elderly Individuals in Urban China Been Satisfied with Nursing Services during the COVID-19 Pandemic? // International Journal of Environmental Research and Public Health. — 2021. — Vol. 18, No. 20. — Art. 10624.
- Liu L., Liu M., Yang L., Chen X., Liu Y., You L. A Patient-Reported Questionnaire for Evaluating Utilization of the National Essential Public Health Service Program in China among Older Adults with Hypertension and Diabetes // Frontiers in Public Health. — 2025. — Vol. 13. — Art. 1459754.
дипломов